Schema monitoring for ClickHouse using Atlas

Automatic ER Diagrams and Docs for ClickHouse
When working with a relational database like ClickHouse, understanding the database schema becomes essential for many functions in the organization. Who cares about the schema? Almost everyone who interacts with your data:
- Software engineers and architects use knowledge about the schema to make design decisions when building software.
- Data engineers need to have an accurate understanding of schemas to build correct and efficient data pipelines.
- Data analysts rely on familiarity with the schema to write accurate queries and derive meaningful insights.
- DevOps, SREs, and Production Engineers use schema information (especially recent changes to it) to triage database-related production issues.
Having clear, centralized documentation of your database's schema and its changes can be a valuable asset to foster efficient work and collaboration. Knowing this, many teams have developed some form of strategy to provide this kind of documentation:
- Diagramming tools. Teams use generic diagramming tools like Miro or Draw.io to maintain ER (Entity-Relation) Diagrams representing their database schema. While this is easy to set up, it requires manually updating the documents whenever something changes, often causing documents to go stale and become obsolete.
- Data modeling tools. Alternatively, teams use database modeling software like DataGrip or DBeaver. While these tools automatically inspect your database, understand its schema, and provide interactive diagrams, they have two main downsides: 1) Since they run locally, they require a direct connection and credentials introducing a potential security risk; 2) They do not enable any collaboration, discussion, or sharing of information.
- Enterprise Data Catalogs like Atlan or Alation, provide extensive schema documentation and monitoring; however, they can be quite pricey and difficult to set up.
Enter: Atlas Schema Monitoring
Atlas offers an automated, secure, and cost-effective solution for monitoring and documenting your ClickHouse schema.
With Atlas, you can:
- Generate ER Diagrams: Visualize your database schema with up-to-date, easy-to-read diagrams.
- Create Searchable Code Docs: Enable your team to quickly find schema details and usage examples.
- Track Schema Changes: Keep a detailed changelog to understand what's changed and why.
- Receive Alerts: Get notified about unexpected or breaking changes to your schema.
All without granting everyone on your team direct access to your production database.
Getting Started
Let's see how to set up Schema Monitoring for your ClickHouse database with Atlas. In this guide, we demonstrate how to run schema monitoring using a GitHub Action, but this can easily be achieved from other CI platforms (such as BitBucket or GitLab).
Prerequisites
- A ClickHouse Cloud account with a running service.
- An Atlas account (start your 30-day free trial here).
- A GitHub repository with permissions to configure GitHub Actions workflows.
1. Create a bot token in Atlas Cloud
Head over to your Atlas Cloud account and click on the top-level Monitoring navigation entry. Choose the GitHub Action card, and click on the Generate Token button. Copy the token.
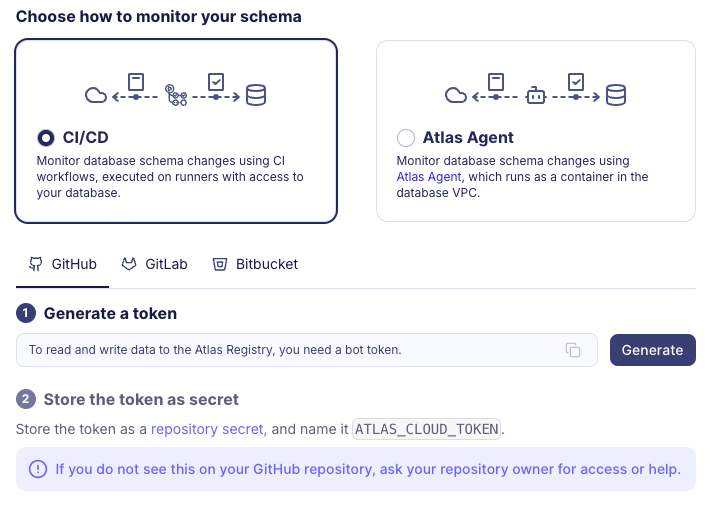
Next, go to your GitHub repository and go to Settings -> Secrets and add a new secret called ATLAS_CLOUD_TOKEN with
the value of the token you just copied.
2. Create a new GitHub Actions Workflow for schema monitoring
Store your database URL as a repository secret
named DB_URL with the value of your database url.
This guide assumes your monitored database instance is reachable from your GitHub Actions runner, which is the case (by default) for ClickHouse Cloud-hosted databases.
Atlas uses URLs to define database connection strings (see docs), to connect to your ClickHouse cloud instance, use this format:
clickhouse://default:<PASS>@<instance ID>.eu-west-2.aws.clickhouse.cloud:9440/default?secure=true
Be sure to use the connection string details specific to your hosted ClickHouse service.
For more options, see the Schema Monitoring Docs.
Next, save the workflow file below as .github/workflows/monitor-schema.yaml in your repository.
Replace the slug with the name you want to give to your database. The slug is used to uniquely identify the database
in Atlas Cloud, even when the database URL changes.
name: Atlas Schema Monitoring
on:
 workflow_dispatch:
 schedule:
   - cron: '0 */4 * * *'  # every 4 hours
jobs:
 monitor:
   runs-on: ubuntu-latest
   steps:
     - uses: ariga/setup-atlas@v0
     - uses: ariga/atlas-action/monitor/schema@v1
       with:
         cloud-token: ${{ secrets.ATLAS_CLOUD_TOKEN }}
         url: ${{ secrets.DB_URL }}
         slug: my-database
Then, commit and push the changes to your repository.
3. Run the GitHub Action
Once committed, let's run the workflow:
- Go to the Actions tab in your repository
- Choose the Atlas Schema Monitoring workflow
- Click on Run Workflow on the top right corner.
After the workflow finishes, you should see a link to Atlas Cloud where you can view the schema of your database:
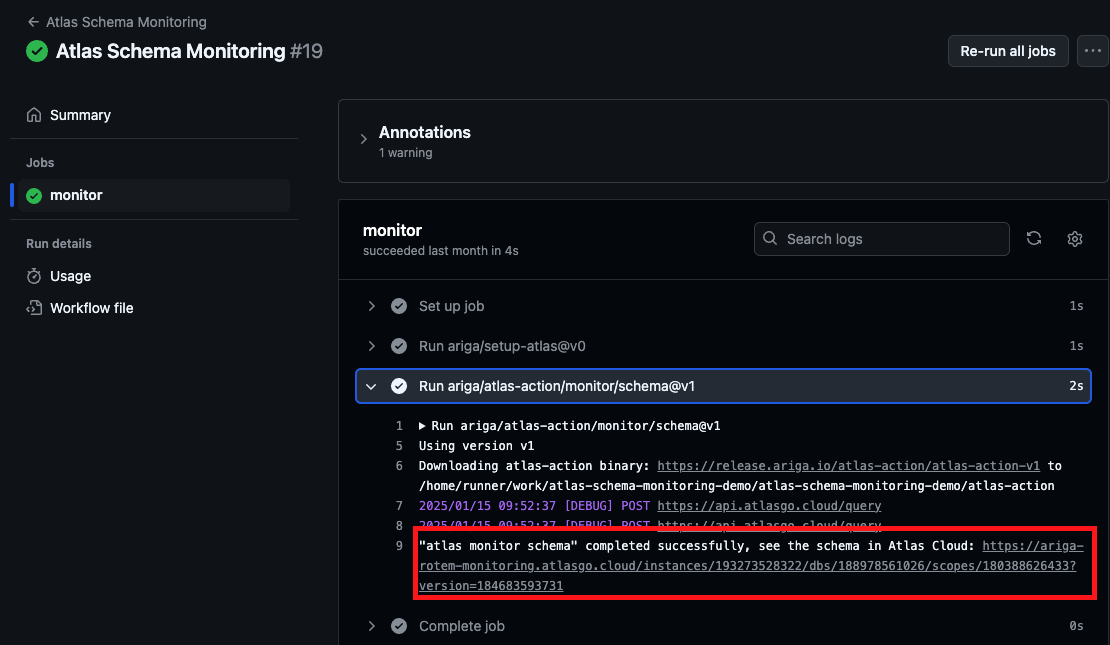
4. View the schema in the Atlas UI
Click on the link provided in the logs to view the schema in the Atlas UI.
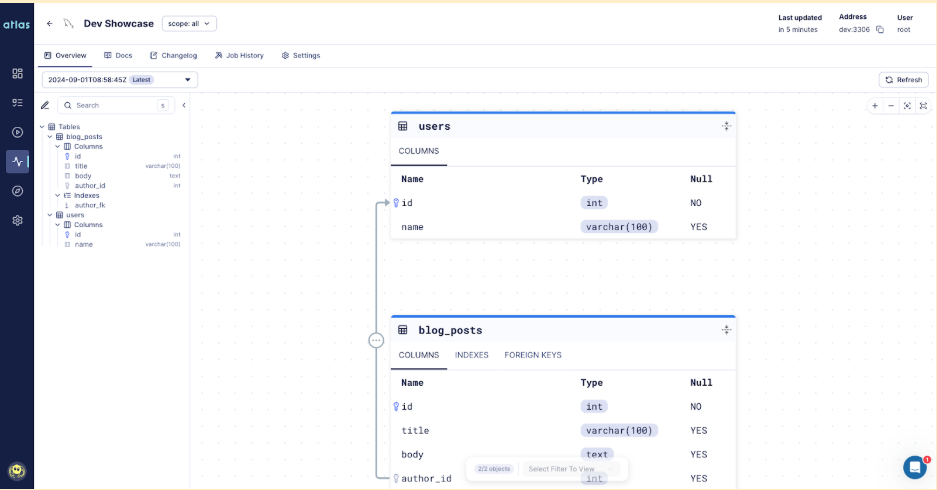
Amazing! We have set up continuous schema monitoring for our ClickHouse database using Atlas and GitHub Actions. The GitHub Action will run every 4 hours, ensuring that the schema documentation is always up-to-date, you can adjust the schedule to fit your needs or run the workflow manually on-demand.
Wrapping Up
We hope you find this new integration useful! As always, we would love to hear your feedback and suggestions on our Discord server.
Additional Reading
- Learn about using Drift Detection in tandem with Schema Monitoring.
- Run Schema Monitoring from a long-running Agent
- Schema Monitoring Documentation