
2 posts tagged with "monitoring"

View All Tags

Schema monitoring for ClickHouse using Atlas

· 5 min read
Rotem Tamir
Building Atlas

Automatic ER Diagrams and Docs for ClickHouse

When working with a relational database like ClickHouse, understanding the database schema becomes essential for many functions in the organization. Who cares about the schema? Almost everyone who interacts with your data:

  • Software engineers and architects use knowledge about the schema to make design decisions when building software.
  • Data engineers need to have an accurate understanding of schemas to build correct and efficient data pipelines.
  • Data analysts rely on familiarity with the schema to write accurate queries and derive meaningful insights.
  • DevOps, SREs, and Production Engineers use schema information (especially recent changes to it) to triage database-related production issues.

Having clear, centralized documentation of your database's schema and its changes can be a valuable asset to foster efficient work and collaboration. Knowing this, many teams have developed some form of strategy to provide this kind of documentation:

  • Diagramming tools. Teams use generic diagramming tools like Miro or Draw.io to maintain ER (Entity-Relation) Diagrams representing their database schema. While this is easy to set up, it requires manually updating the documents whenever something changes, often causing documents to go stale and become obsolete.
  • Data modeling tools. Alternatively, teams use database modeling software like DataGrip or DBeaver. While these tools automatically inspect your database, understand its schema, and provide interactive diagrams, they have two main downsides: 1) Since they run locally, they require a direct connection and credentials introducing a potential security risk; 2) They do not enable any collaboration, discussion, or sharing of information.
  • Enterprise Data Catalogs like Atlan or Alation, provide extensive schema documentation and monitoring; however, they can be quite pricey and difficult to set up.

Enter: Atlas Schema Monitoring

Atlas offers an automated, secure, and cost-effective solution for monitoring and documenting your ClickHouse schema.

With Atlas, you can:

  • Generate ER Diagrams: Visualize your database schema with up-to-date, easy-to-read diagrams.
  • Create Searchable Code Docs: Enable your team to quickly find schema details and usage examples.
  • Track Schema Changes: Keep a detailed changelog to understand what's changed and why.
  • Receive Alerts: Get notified about unexpected or breaking changes to your schema.

All without granting everyone on your team direct access to your production database.

Getting Started

Let's see how to set up Schema Monitoring for your ClickHouse database with Atlas. In this guide, we demonstrate how to run schema monitoring using a GitHub Action, but this can easily be achieved from other CI platforms (such as BitBucket or GitLab).

Prerequisites

  1. A ClickHouse Cloud account with a running service.
  2. An Atlas account (start your 30-day free trial here).
  3. A GitHub repository with permissions to configure GitHub Actions workflows.

1. Create a bot token in Atlas Cloud

Head over to your Atlas Cloud account and click on the top-level Monitoring navigation entry. Choose the GitHub Action card, and click on the Generate Token button. Copy the token.

Next, go to your GitHub repository and go to Settings -> Secrets and add a new secret called ATLAS_CLOUD_TOKEN with the value of the token you just copied.

2. Create a new GitHub Actions Workflow for schema monitoring

Store your database URL as a repository secret named DB_URL with the value of your database url.

ClickHouse Cloud URL

This guide assumes your monitored database instance is reachable from your GitHub Actions runner, which is the case (by default) for ClickHouse Cloud-hosted databases.

Atlas uses URLs to define database connection strings (see docs), to connect to your ClickHouse cloud instance, use this format:

clickhouse://default:<PASS>@<instance ID>.eu-west-2.aws.clickhouse.cloud:9440/default?secure=true

Be sure to use the connection string details specific to your hosted ClickHouse service.

For more options, see the Schema Monitoring Docs.

Next, save the workflow file below as .github/workflows/monitor-schema.yaml in your repository.

Replace the slug with the name you want to give to your database. The slug is used to uniquely identify the database in Atlas Cloud, even when the database URL changes.


name: Atlas Schema Monitoring
on:
workflow_dispatch:
schedule:
- cron: '0 */4 * * *' # every 4 hours
jobs:
monitor:
runs-on: ubuntu-latest
steps:
- uses: ariga/setup-atlas@v0
- uses: ariga/atlas-action/monitor/schema@v1
with:
cloud-token: ${{ secrets.ATLAS_CLOUD_TOKEN }}
url: ${{ secrets.DB_URL }}
slug: my-database

Then, commit and push the changes to your repository.

3. Run the GitHub Action

Once committed, let's run the workflow:

  1. Go to the Actions tab in your repository
  2. Choose the Atlas Schema Monitoring workflow
  3. Click on Run Workflow on the top right corner.

After the workflow finishes, you should see a link to Atlas Cloud where you can view the schema of your database:

4. View the schema in the Atlas UI

Click on the link provided in the logs to view the schema in the Atlas UI.

Amazing! We have set up continuous schema monitoring for our ClickHouse database using Atlas and GitHub Actions. The GitHub Action will run every 4 hours, ensuring that the schema documentation is always up-to-date, you can adjust the schedule to fit your needs or run the workflow manually on-demand.

Wrapping Up

We hope you find this new integration useful! As always, we would love to hear your feedback and suggestions on our Discord server.

Additional Reading

What is Schema Monitoring and Atlas v0.27

· 4 min read
Rotem Tamir
Building Atlas

Hi Everyone,

It's been a few weeks since our last release, and I'm very excited to share with you the news of Atlas v0.27. In this release, you will find:

  • Atlas Schema Monitoring: A new product that provides a set of tools and features to help you manage and monitor your database schema effectively.
  • Pay via AWS Marketplace: Atlas users can now pay for their Atlas subscription via the AWS Marketplace.
  • Atlas HCL Doc Portal: A new portal that contains always up to date, automatically generated documentation for the Atlas HCL language.

Introducing Schema Monitoring

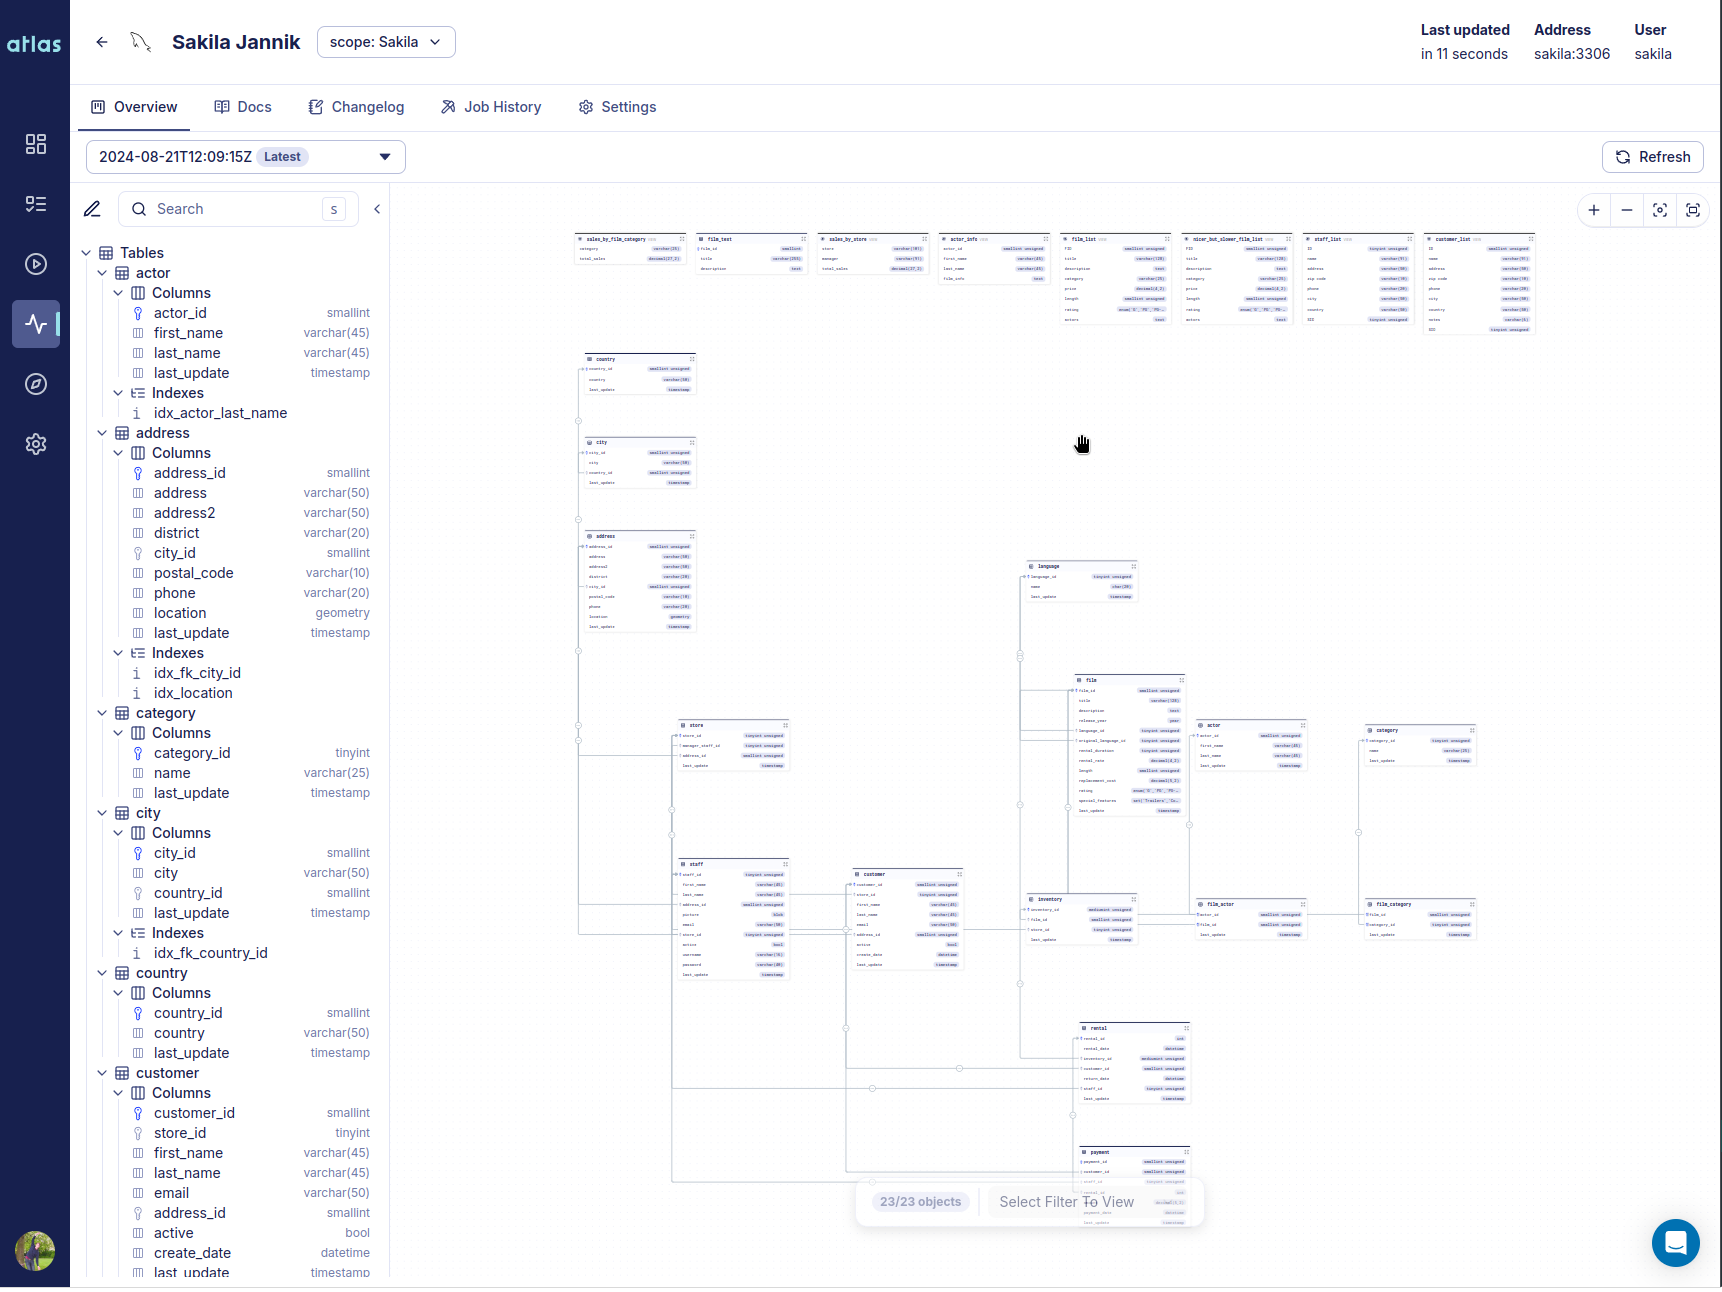
The hallmark of this release is a new product we call Atlas Schema Monitoring. Atlas Schema Monitoring provides a set of tools and features to help you manage and monitor your database schema effectively. Teams install an agent (container) on their database VPC which tracks changes to the database schema and reports metadata to the Atlas Cloud control plane. Using this metadata Atlas Schema Monitoring provides:

  1. Live visibility of your database schema with automated ER diagrams and auto-generated documentation.
  2. A Changelog of schema changes, so you can see how schemas change over time, and easily triage schema change related issues.
  3. Alerts Use Webhooks or Slack notifications to inform or alert teams that need to know about schema changes or drift.

Starting today, we are providng one free monitored instance to all signed up Atlas users.

A Live Demo is available for you to try out.

How it works

Atlas Cloud never has direct access to your database, instead it uses a middleman, the Atlas agent, to connect to your database instead. In order for this to work, the agent needs to be installed somewhere with network connectivity to the database, usually within the same VPC as the database. In addition, the agent should have outbound connectivity to your cloud account (e.g.,https://your-tenant.atlasgo.cloud).

The agent then starts polling Atlas Cloud for work. Once assigned a task, it connects to the database and executes the task, e.g. "take a snapshot" and then reports back the result to Atlas Cloud. The Agent does not read or report back any user data, only meta information about the database schema.

To read more about the key concepts and features of Atlas Schema Monitoring, head over to the Overview page.

Getting started

To get started with Schema Monitoring in under 5 minutes, head over to the Quickstart guide.

Security

Atlas Schema Monitoring is designed with the principle of minimal access in mind. The Atlas agent is designed to only require read-only access to the database schema and only requires access to system information schema tables and not user data.

Additionally, to provide further security and control, database credentials are never provided or stored in the Atlas Cloud control plane. Instead, the Atlas agent is deployed in your environment and connects to the database directly using a variety of secure methods.

To learn more about how to securely provide database credentials to the Atlas agent, head over to the Security and Credentials guide.

Pay via AWS Marketplace

Atlas users can now pay for their Atlas subscription via the AWS Marketplace. This is a great option for users who prefer to consolidate their billing and payments in one place or have AWS credits they would like to use.

To purchase Atlas quota via the AWS Marketplace, visit our Product Page.

Atlas HCL Doc Portal

Atlas enables users manage their database schema as code. One of the popular ways to define the desired state of your is via the Atlas HCL data definition language. Additionally, users have a powerful configuration language to define their project configuration.

We have added a new Atlas HCL Portal to the documentation website, which contains always up to date, automatically generated documentation for the Atlas HCL language.

Wrapping Up

That's all for this release! We hope you enjoy the new features and improvements. As always, we would love to hear your feedback and suggestions on our Discord server.