Monitor Database Schema Changes with GitHub Actions
In order to function, Atlas must be able to establish a connection to your database. This means you need to ensure that your database is accessible from the GitHub Actions runners.
To learn about different approaches to establish network access, see the Connect to your database from GitHub Actions guide.
The following guide will quickly walk you through how to get started with Atlas Schema Monitoring in under 5 minutes using GitHub Actions and Atlas Cloud with the
ariga/atlas-action/monitor/schema Action. Set up continuous schema monitoring, configure secrets, and view schema changes in the Atlas UI.
Set Up a Database User
To use schema monitoring, you need to create a database user with the appropriate privileges. Then use this user in the database connection URL that you will provide to the GitHub Actions workflow.
- PostgreSQL
- MySQL
To enable Atlas monitoring for your PostgreSQL database, you need to create a dedicated monitoring user with read-only permissions. This user will allow Atlas to connect and inspect your database schema without any write access.
For databases with password authentication:
-- Create a monitoring account
CREATE USER atlas_monitor WITH PASSWORD 'strong_password';

-- Grant read access to specific schema for current and future tables
GRANT SELECT ON ALL TABLES IN SCHEMA <schema_name> TO atlas_monitor;
ALTER DEFAULT PRIVILEGES IN SCHEMA <schema_name> GRANT SELECT ON TABLES TO atlas_monitor;
For AWS RDS databases using IAM authentication:
If you're using AWS RDS with IAM database authentication, create a user without a password. The username must match the resource specified in your IAM policy.
-- Create a monitoring account. User name is the same as a resource in the IAM policy for IAM database access
CREATE USER atlas_monitor;

-- Allow connect to the database via IAM authentication
GRANT rds_iam TO atlas_monitor;

-- Grant read access to specific schema for current and future tables
GRANT SELECT ON ALL TABLES IN SCHEMA <schema_name> TO atlas_monitor;
ALTER DEFAULT PRIVILEGES IN SCHEMA <schema_name> GRANT SELECT ON TABLES TO atlas_monitor;
To configure IAM authentication in your Atlas configuration, refer to the IAM authentication guide.
To enable Atlas monitoring for your MySQL database, create a dedicated monitoring user with the minimum required permissions. This user only needs read access to inspect your database schema.
For databases with password authentication:
-- Create monitoring account (replace host as needed)
CREATE USER 'atlas_monitor'@'%' IDENTIFIED BY 'strong_password';

-- Grant read access
GRANT SHOW DATABASES ON *.* TO 'atlas_monitor'@'%';
GRANT SHOW VIEW ON *.* TO 'atlas_monitor'@'%';
GRANT SELECT ON *.* TO 'atlas_monitor'@'%';
GRANT TRIGGER ON *.* TO 'atlas_monitor'@'%';
For AWS RDS databases using IAM authentication:
If you're using AWS RDS with IAM database authentication, create a user that uses the AWS authentication plugin instead of a password.
-- Create monitoring account (replace host as needed)
CREATE USER 'atlas_monitor'@'%' IDENTIFIED WITH AWSAuthenticationPlugin AS 'RDS';

-- Grant read access
GRANT SHOW DATABASES ON *.* TO 'atlas_monitor'@'%';
GRANT SHOW VIEW ON *.* TO 'atlas_monitor'@'%';
GRANT SELECT ON *.* TO 'atlas_monitor'@'%';
GRANT TRIGGER ON *.* TO 'atlas_monitor'@'%';
To configure IAM authentication in your Atlas configuration, refer to the IAM authentication guide.
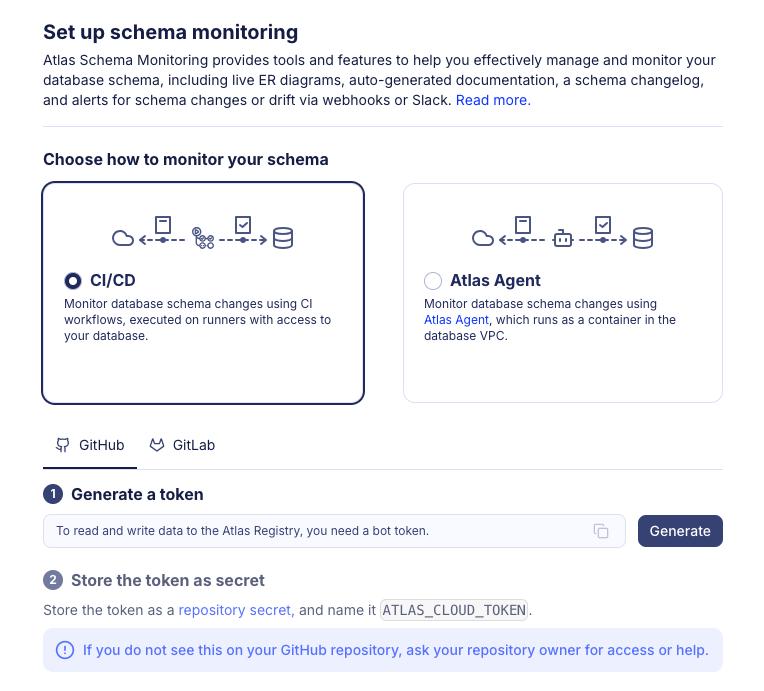
Create a Bot Token in Atlas Cloud
Head over to your Atlas Cloud account and click on the top level ☰ > Monitoring navigation entry. Choose the CI Pipeline card, Choose the GitHub tab, and click on the Generate button. Copy the token.
Follow to your GitHub repository and go to Settings -> Secrets and add a new secret called ATLAS_CLOUD_TOKEN
with the value of the token you just copied.
Create a New GitHub Actions Workflow for Schema Monitoring
Save the workflow file below as .github/workflows/monitor-schema.yaml in your repository.
Make sure that DB_URL is stored as a repository secret with the value of your database url
or replace ${{ secrets.DB_URL }} with your database url.
Replace the slug with the name you want to give to your database.
The slug is used to uniquely identify the database in Atlas Cloud, even when the database URL changes.
name: Atlas Schema Monitoring
on:
  workflow_dispatch:
  schedule:
    - cron: '0 */4 * * *'  # every 4 hours
jobs:
  monitor:
    runs-on: ubuntu-latest
    steps:
      - uses: ariga/setup-atlas@v0
      - uses: ariga/atlas-action/monitor/schema@v1
        with:
          cloud-token: ${{ secrets.ATLAS_CLOUD_TOKEN }}
          url: ${{ secrets.DB_URL }}
          slug: my-database
If your database URL is defined inside atlas.hcl file, you can use the config instead of url in the with section.
For more information, see the GitHub Actions documentation.
          cloud-token: ${{ secrets.ATLAS_CLOUD_TOKEN }}
-         url: ${{ secrets.DB_URL }}
+         config: "file://atlas.hcl"
+         env: "dev"
Enable statistics collection
To collect and monitor database statistics (such as table sizes, row counts, and index usage) along with your schema, add the collect-stats parameter and set it to "true":
name: Atlas Schema Monitoring
on:
  workflow_dispatch:
  schedule:
    - cron: '0 */4 * * *'  # every 4 hours
jobs:
  monitor:
    runs-on: ubuntu-latest
    steps:
      - uses: ariga/setup-atlas@v0
      - uses: ariga/atlas-action/monitor/schema@v1
        with:
          cloud-token: ${{ secrets.ATLAS_CLOUD_TOKEN }}
          url: ${{ secrets.DB_URL }}
          slug: my-database
          collect-stats: "true"
When enabled, Atlas will collect statistics about your database schema during each monitoring run. These statistics are displayed in the Atlas Cloud UI alongside your schema information, helping you track database growth and performance metrics over time.
Then commit and push the changes to your repository.
Run the GitHub Action
Once committed, go to the Actions tab in your repository, choose the Atlas Schema Monitoring workflow, and click on Run workflow.
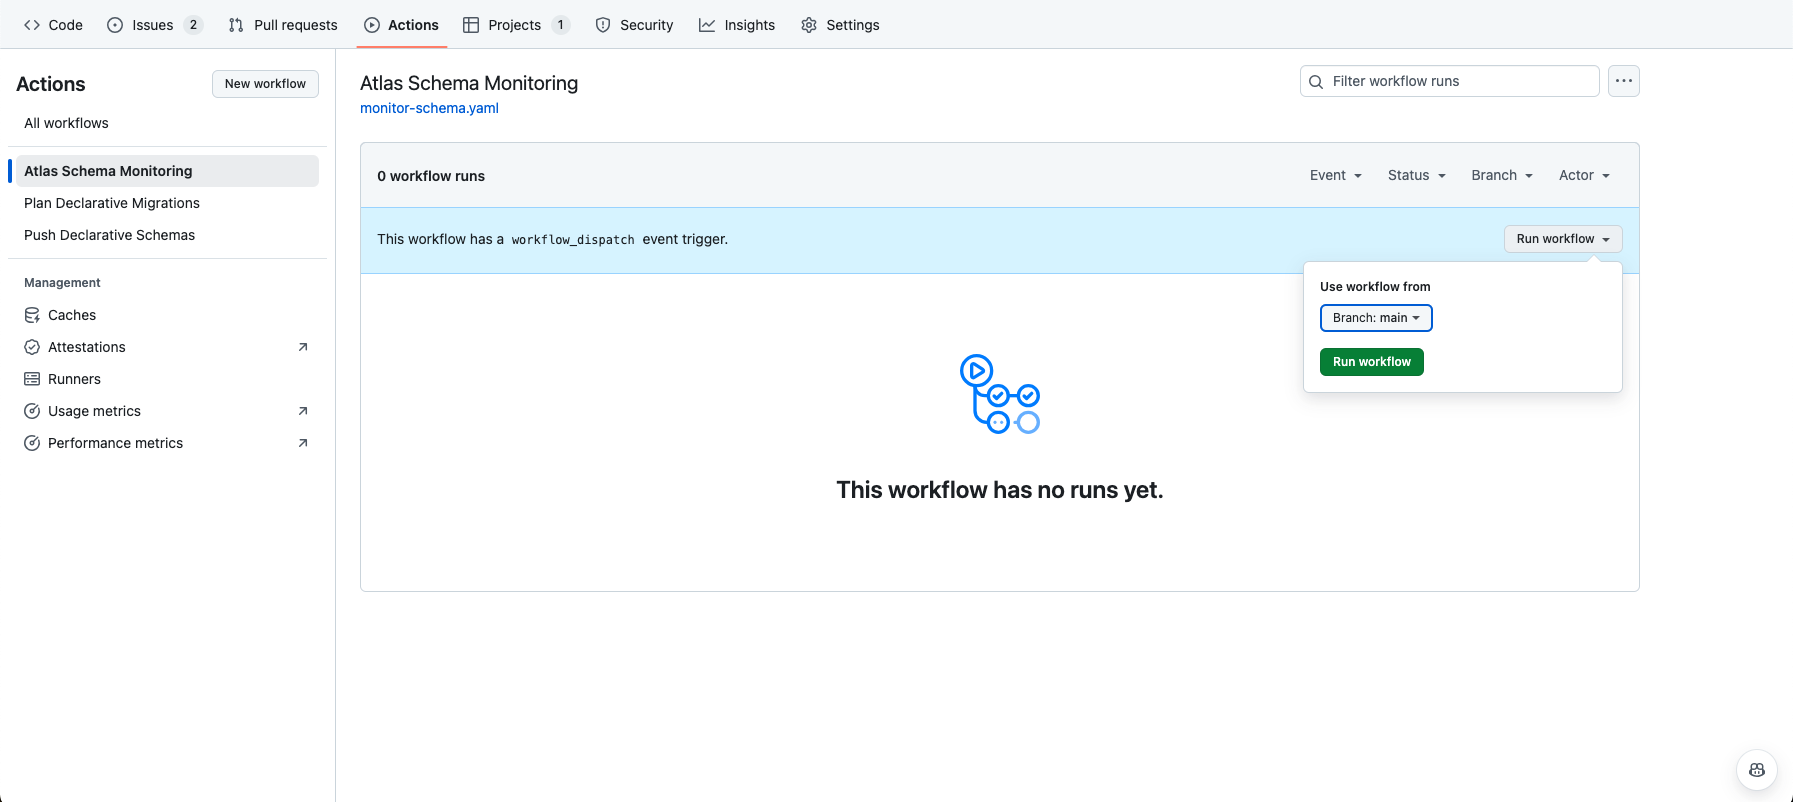
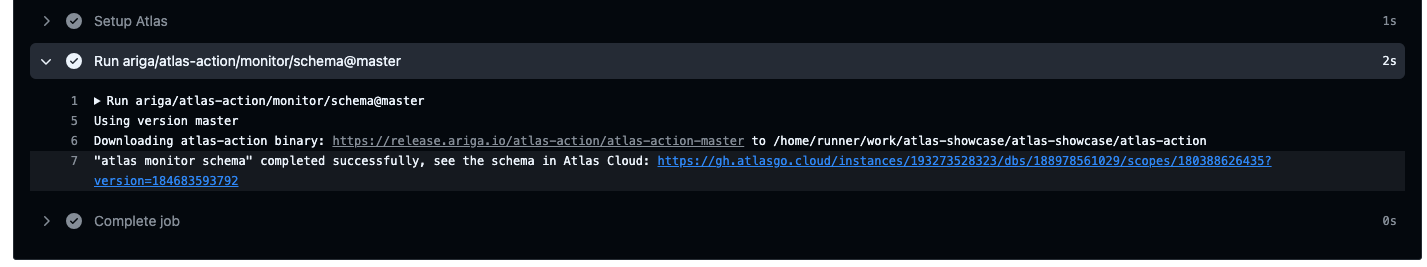
After the workflow finishes, it should show you a link to the Atlas Cloud where you can view the schema of your database.
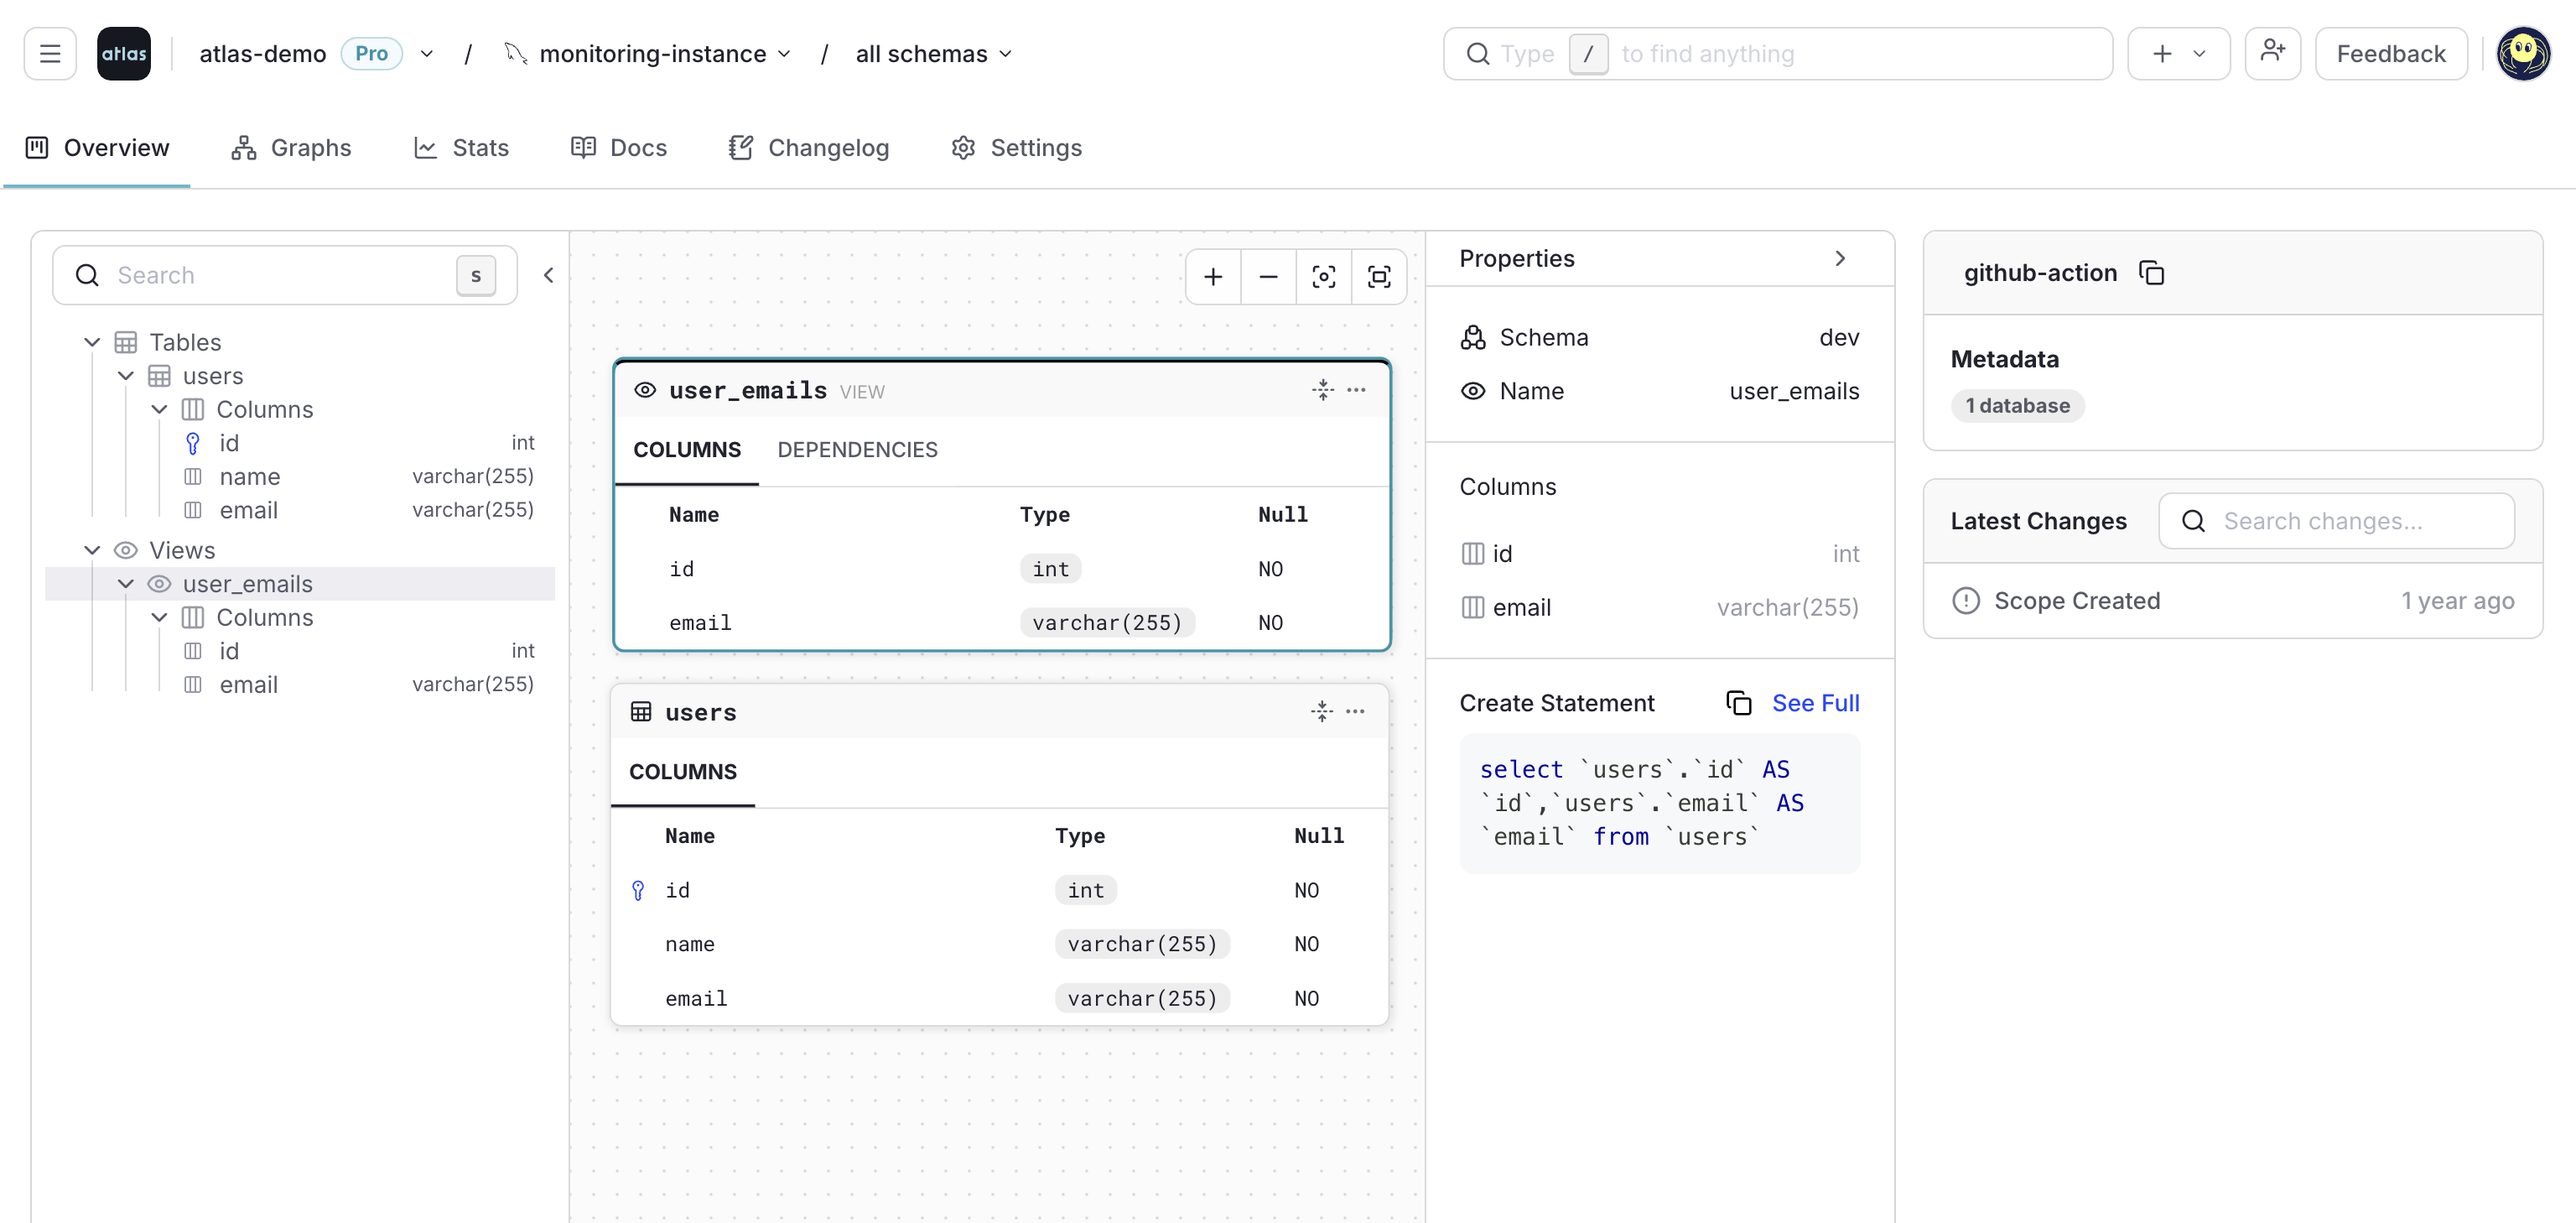
View the Schema in the Atlas UI
Click on the link provided in the logs to view the schema in the Atlas UI.