Atlas Schema Monitoring: Architecture, Agents, and Key Features
Overview
Atlas Schema Monitoring inspects the schema of your live databases and reports it to Atlas Cloud. Atlas Cloud keeps every snapshot and renders it as an ERD and schema docs. It records each change in a changelog, and compares the schema against its intended state to detect drift.
Architecture
Atlas agent
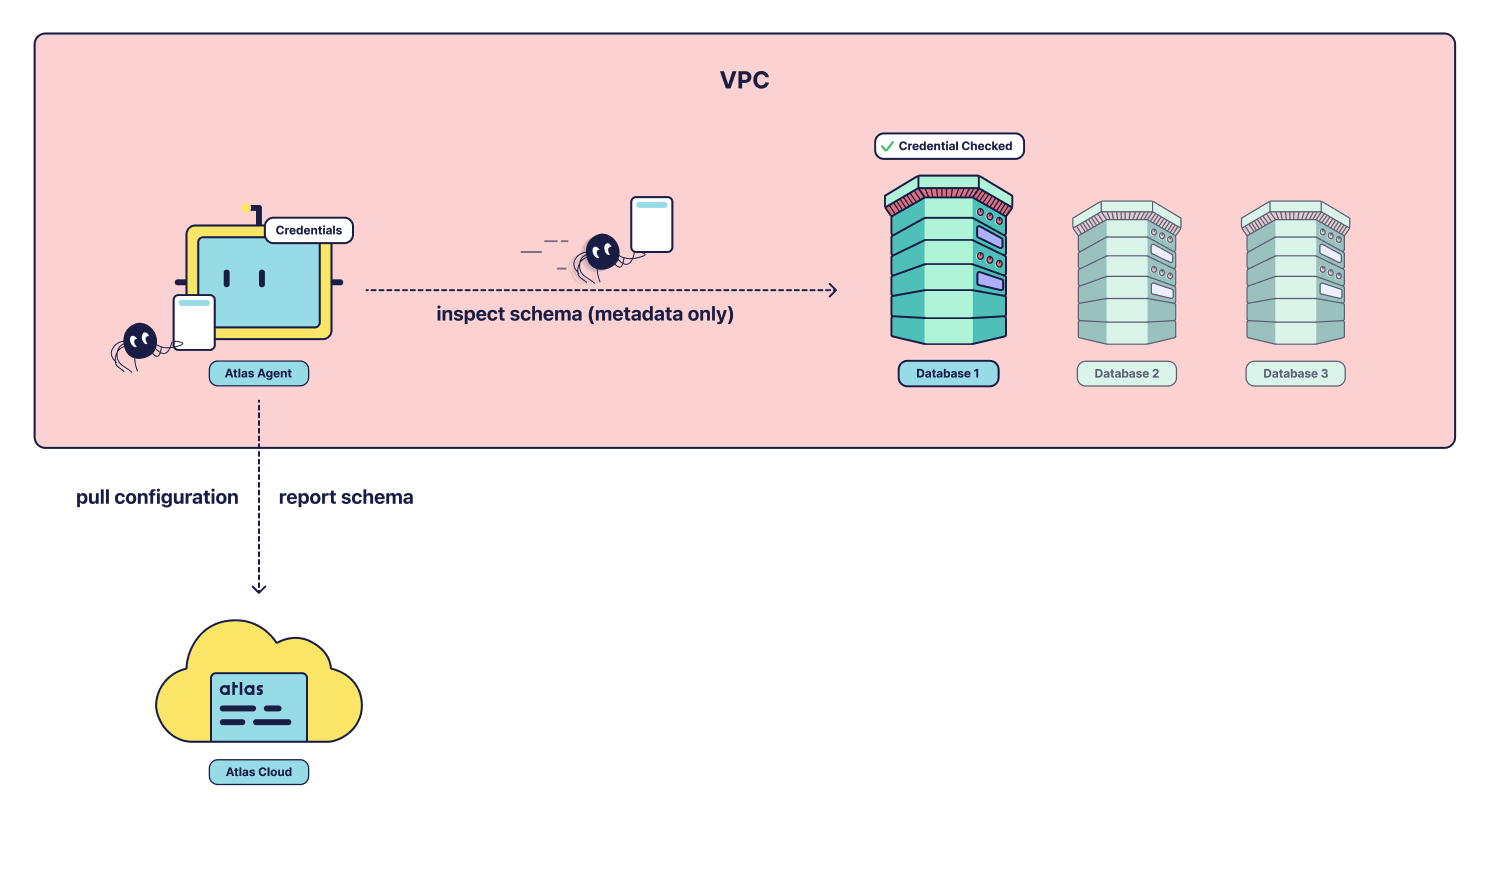
Atlas Cloud never connects to your database directly. The Atlas agent connects on its behalf. Install the agent where it can reach the database, usually in the same VPC. The agent also needs outbound access to your Atlas Cloud account. No inbound connection to your network is required.
The agent polls Atlas Cloud for work. When it receives a task, such as "take a snapshot", it connects to the database, runs the task, and reports the result back to Atlas Cloud.
Database credentials stay in your environment. The agent reads them at runtime from environment variables, cloud IAM roles, or a secret manager, and never sends them to Atlas Cloud. See Security and Credentials for the supported methods.
Configure the agent in an agent.hcl file. Each
instance block defines a database connection. Its
default_monitor and
monitor blocks set which databases and schemas to
snapshot, how often (snapshot_interval, minimum 1m), and whether to collect table statistics. To
register instances without defining each connection by hand, use
Database Discovery for Amazon RDS, Cloud SQL, AlloyDB, and Spanner.
 Agent Quickstart
 Deploying with Helm
 Deploying with Terraform
CI pipeline
A scheduled pipeline runs the Atlas monitor action on a CI runner. The action inspects the database and
reports the schema to Atlas Cloud with a bot token. The schedule sets how often Atlas
sees changes. Set the action's collect-stats input to also collect table statistics.
The CI runner must have network access to the database. Store the database URL and the Atlas Cloud token as secrets of the monitoring job only.
 GitHub Actions
 GitLab CI
 Bitbucket Pipelines
Key Capabilities
ERD and schema documentation
Every monitored schema gets an ERD of its tables and the relationships between them.

Atlas also generates schema documentation from the latest snapshot.

Schema changelog
Atlas compares each new snapshot with the previous one. When the schema changed, Atlas adds an entry to the changelog with the details of what was modified. Use the changelog to trace an incident back to the schema change that caused it.

Table statistics
With statistics enabled, Atlas collects table sizes, row counts, and index usage with each snapshot, so
you can track how a database grows over time. Enable them with the statistics block in the
agent configuration, or with the collect-stats
input in a CI pipeline.
Drift detection
Schema drift happens when the live schema no longer matches its intended state, for example after a manual change made outside the deployment pipeline. Configure a drift check to compare a monitored schema against another monitored database or a deployed migration target. Detected drift is highlighted in the changelog, with an ERD and the HCL and SQL diff.
See Drift Detection to set up a drift check.

Notifications
Send monitored schema changes and drift events to a Slack channel, so the team that owns a database learns about a change without opening Atlas Cloud. See Slack Notifications to connect a workspace and choose the events.
 Atlas Agent Setup
 Drift Detection
 Agent HCL Reference